
Switzerland's AI map is upside down
The more you earn, the more exposed you are
I built a map of every job in Switzerland and how exposed it is to AI. It covers 406 occupations and 3.9 million jobs. Each tile is an occupation, sized by how many people do it and colored by how much of its core work current AI can do or speed up, on a scale from 0 to 10. The scores come from having Claude read the ESCO task descriptions for each occupation. The employment and wage numbers come from the Federal Statistical Office.
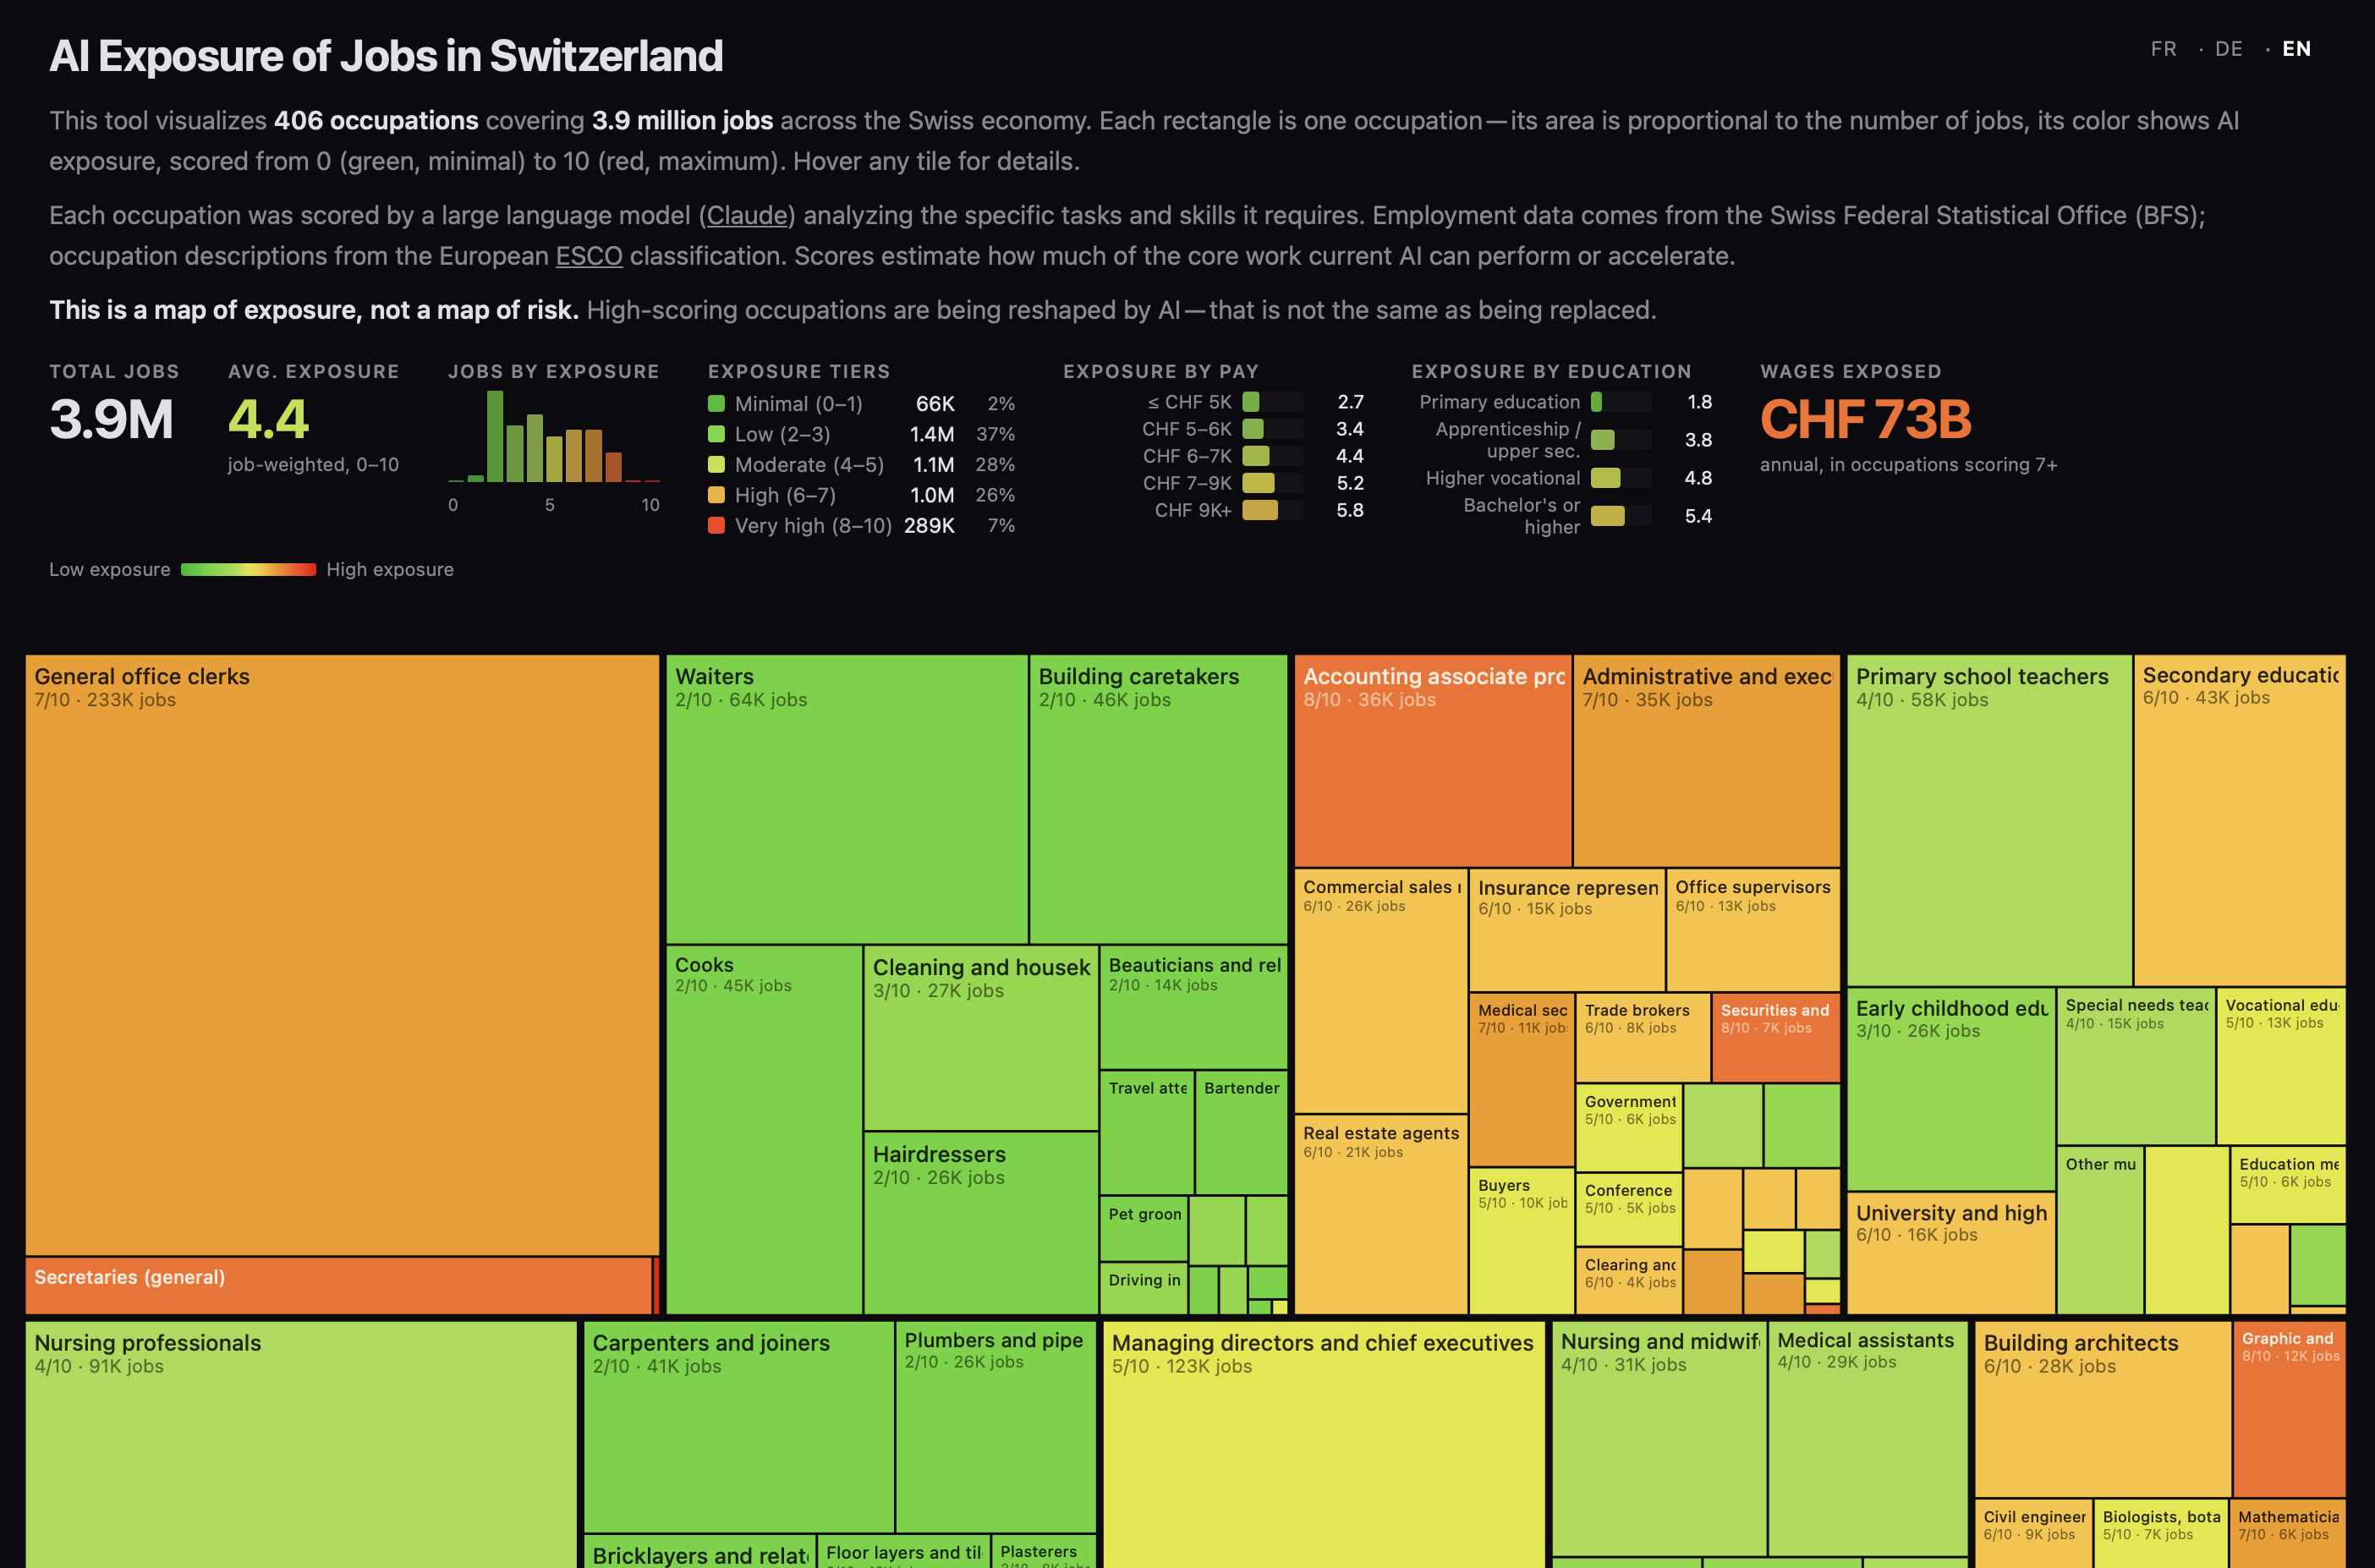
I expected the usual picture: automation hits the bottom of the ladder first. The map shows the opposite.
Exposure rises with pay, step by step. Jobs paying up to CHF 5,000 a month average 2.7. Jobs paying over CHF 9,000 average 5.8. It rises with education the same way: 1.8 for people with primary schooling, 3.8 for apprenticeship graduates, 4.8 for higher vocational degrees, 5.4 for a bachelor's or more. There is no bump and no exception. The line just goes up.
The most exposed group in the country is ICT professionals, at 7.5. Then come general office clerks, business and administration professionals, and accounting. The single biggest occupation in Switzerland, general office clerk, employs 233,000 people and scores 7. Software developers, 55,000 of them, score 8. Add it up and the occupations scoring 7 or higher carry CHF 73 billion in annual wages.
At the other end sit the jobs Switzerland tends to worry about least. Builders score 1.9, cleaners 1.8, waiters and hairdressers around 2, care workers 2.4. The apprenticeship system, which much of the world spent decades treating as a consolation prize for kids who didn't make it to university, turns out to have produced the most AI-resistant workforce in the country.
Two things to be careful about.
First, this is a map of exposure, not of risk. A score of 8 means AI can do or accelerate most of the core tasks. It says nothing about whether that leads to fewer jobs or to more output per job. Historically it has often been the second. When spreadsheets arrived, the number of accountants went up, not down.
Second, the scores are a model's judgment of task descriptions, not observed outcomes. They're a good first approximation and a bad last word. Hover over any tile and you can read the reasoning and disagree with it.
What I take from the map is this. The people most exposed are also the people best placed to benefit, because they're the experts in their domain, and the evidence so far is that experts get far more out of AI than novices do. The question for a Swiss accountant, developer, or office manager isn't whether AI touches their work. It already does. It's whether they end up managing it or being managed by it.
Go find your own tile, and tell me where you think the score is wrong.